


Your Shopify dashboard says revenue is up. Meta says ROAS is 4.2x. But when you check your bank account, the numbers do not add up.
If this sounds familiar, you are not alone. A lot of D2C brands using Shopify are making decisions based on incomplete or misleading data.
To be clear, Shopify analytics are not useless. The problem is that people expect them to answer questions they were not built to answer. Shopify is good for tracking store activity. It is not great at telling you why performance changed, which channel actually drove the sale, or whether that revenue was profitable.
That is where brands start making bad decisions.
Discount Code Tracking Is Harder Than It Should Be
One common issue is discount code attribution.
A lot of brands pass custom data through checkout using fields like note_attributes to track things like campaign source, influencer codes, or offer details. The problem is that this data is not easy to use inside Shopify’s native reports. It exists, but it is not surfaced in a way that helps performance teams make quick decisions.
So what do most teams do? They export CSVs, combine data manually, and try to figure it out in spreadsheets.
One D2C brand we worked with had more than 15 active discount codes running across influencer partnerships, email campaigns, and retargeting offers. They could see that codes were being used. What they could not see clearly was which ones were driving profitable new orders and which ones were just reducing margin on purchases that would have happened anyway.
That is the real problem. It is not just about whether a code got used. It is about whether that code actually created incremental revenue.
If you run discount-heavy campaigns, Shopify only gives you part of the picture.
Revenue Spikes Show Up, But the Reason Does Not
This is another major gap.
You see a 40% revenue spike over the last three days. Good. Where did it come from?
That should be easy to answer. But for most teams, it turns into a long process across Shopify, ad platforms, GA4, and spreadsheets.
Shopify shows the spike. It usually does not tell you which state, city, product mix, customer segment, or campaign is behind it. The same issue shows up when cancellations increase. Shopify shows the number, but not the underlying pattern.
That is the problem. It tells you what happened, but not why.
Were the cancellations coming from specific cities? Were they mostly COD orders? Were they tied to one product or one campaign? Did one offer increase orders but also increase returns?
These are the questions operators actually need answered. Shopify’s native analytics usually keeps every metric in its own box.
That is why tools built for anomaly detection and root cause analysis matter. They help you move from reporting to actual diagnosis.
Platform-Reported ROAS Is Not the Same as Real ROAS
This is where many brands lose money.
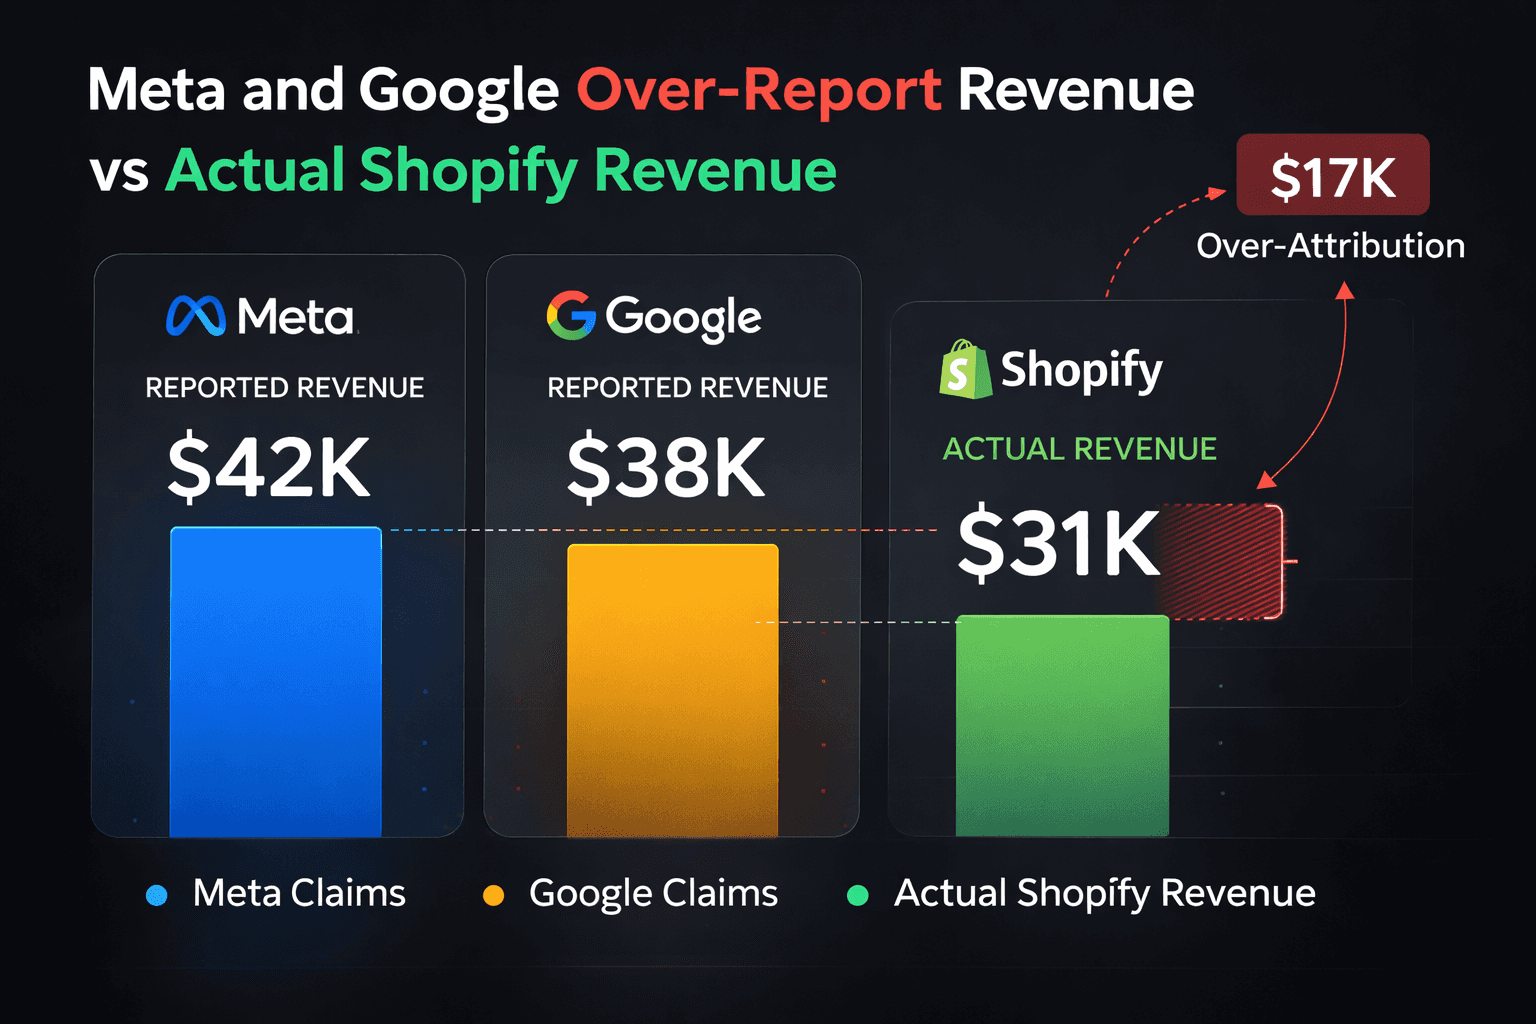
Meta says a campaign delivered 4.2x ROAS. Google says 3.8x. Add both numbers together and the reported revenue is often higher than what Shopify actually shows.
That is because both platforms can take credit for the same conversion.
Shopify does not solve this well either. Its attribution model is too simple for how people actually buy. It tends to give too much credit to the final touchpoint and not enough to the campaigns that created the demand earlier.
So branded search and retargeting start looking stronger than they really are, while prospecting looks weaker than it actually is. Then brands do the wrong thing. They cut the campaigns bringing in new demand and put more budget into the campaigns that are just closing existing demand.
Then growth slows down.
If you have ever had good ROAS but could not scale, bad attribution is often a big reason why.
Good platform ROAS does not always mean real incremental growth.
Google Ads Data Often Gets Reviewed Without Store Context
A lot of marketers review Google Ads in isolation.
They look at CPC, CTR, conversion rate, and ROAS. But that only tells part of the story. Google Ads performance only makes sense when you compare it with what is happening inside the store.
One brand asked us to review Google Ads performance while excluding offer-led campaigns. They wanted to understand the actual efficiency of their non-promotional campaigns. Shopify could not answer that clearly because it does not naturally separate store outcomes the way a marketer wants to analyze them.
This is the bigger issue with most ecommerce reporting setups. Ad data sits in one place. Store revenue sits in another. Returns, discount behavior, and geography sit somewhere else.
So brands are not really missing data. They are missing connection between data sources.
That is where ad intelligence becomes useful. When you connect ad performance with store-level outcomes, the analysis becomes much more useful.
Until then, most teams are just reading platform dashboards at face value.
The RTO Problem Gets Missed Too Often
This is a big issue for D2C brands, especially in India.
A brand may look healthy on the surface. ROAS looks fine. Orders are coming in. Revenue looks strong.
Then finance starts asking why margins are lower than expected.
That is usually when return-to-origin becomes impossible to ignore.
If a large share of orders from certain regions gets refused, cancelled, or returned, your reported revenue is not giving you the full truth. It tells you what happened at checkout. It does not tell you what actually stayed as revenue.
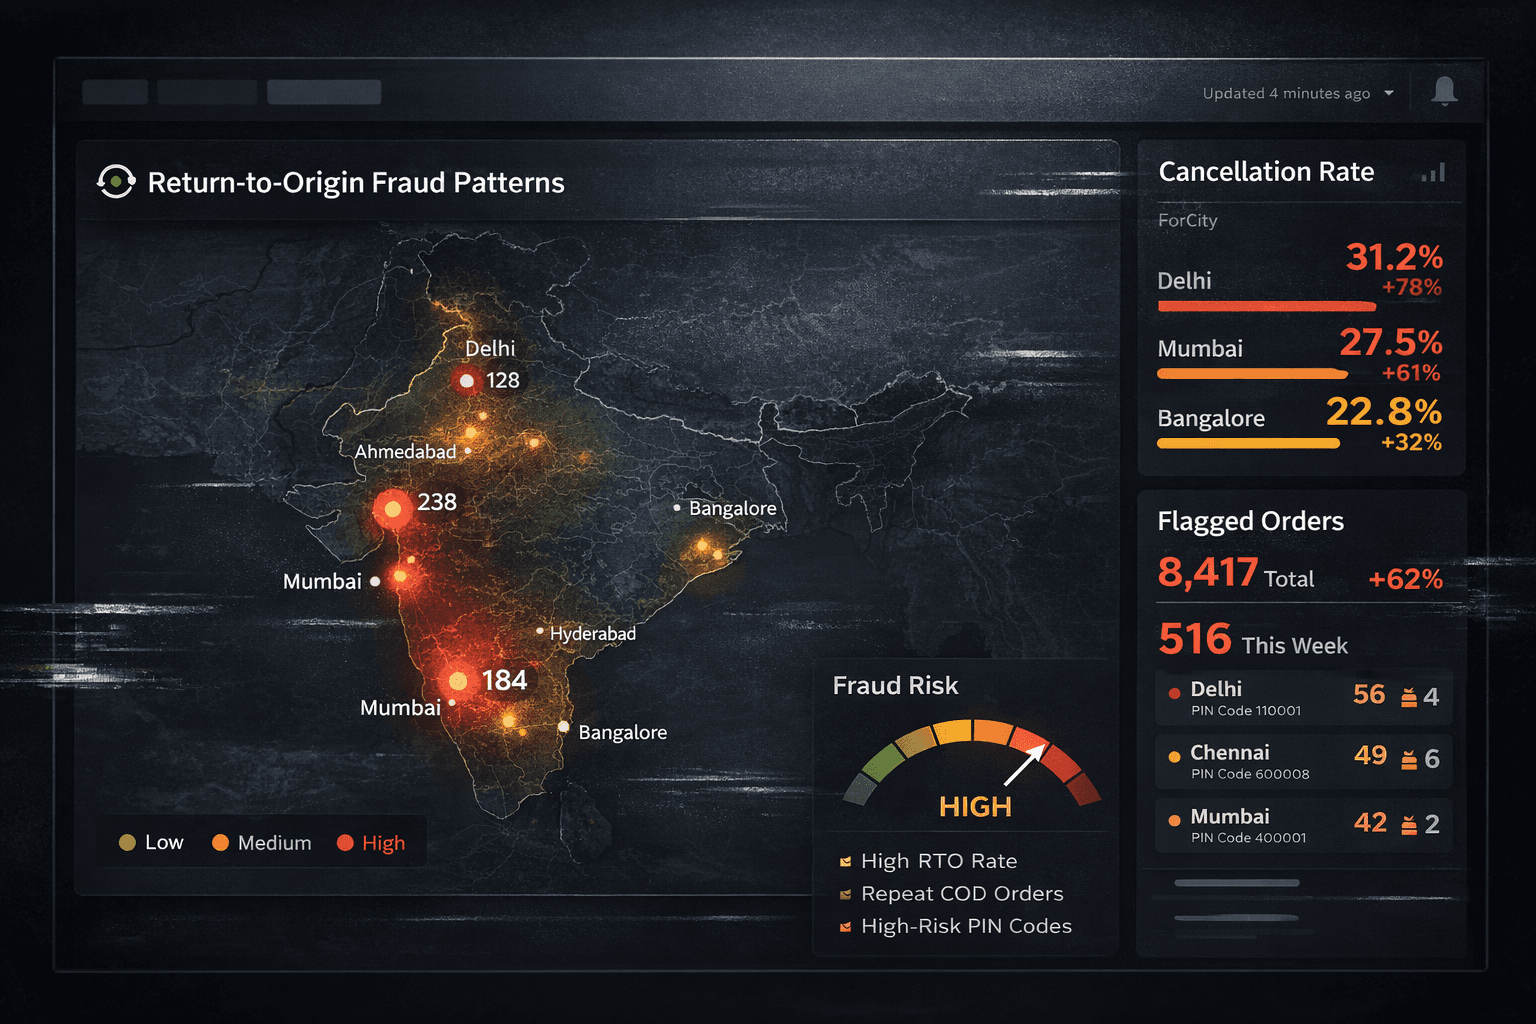
One brand found that a large share of RTOs was coming from tier 1 cities. That went against what the team believed. They expected tier 2 and tier 3 cities to be the bigger issue. But deeper analysis showed clustering around certain locations and repeat low-intent order patterns.
Shopify showed the cancellation numbers. It did not clearly show the pattern.
That is why RTO is so dangerous. It can sit inside healthy-looking topline numbers while quietly damaging profitability.
What You Can Do About It
The answer is not to stop using Shopify analytics.
The answer is to use Shopify for what it does well, and stop expecting it to answer deeper performance questions on its own.
Use Shopify for store operations, order tracking, and basic sales visibility.
But for attribution, anomaly detection, and cross-platform analysis, you need more than native reporting.
A few practical steps help right away.
Audit your discount code tracking so every code can be traced back to a real source.
Set up alerts for revenue, cancellation, and conversion changes so you catch issues quickly.
Do not use platform-reported ROAS as your only source of truth for budget decisions.
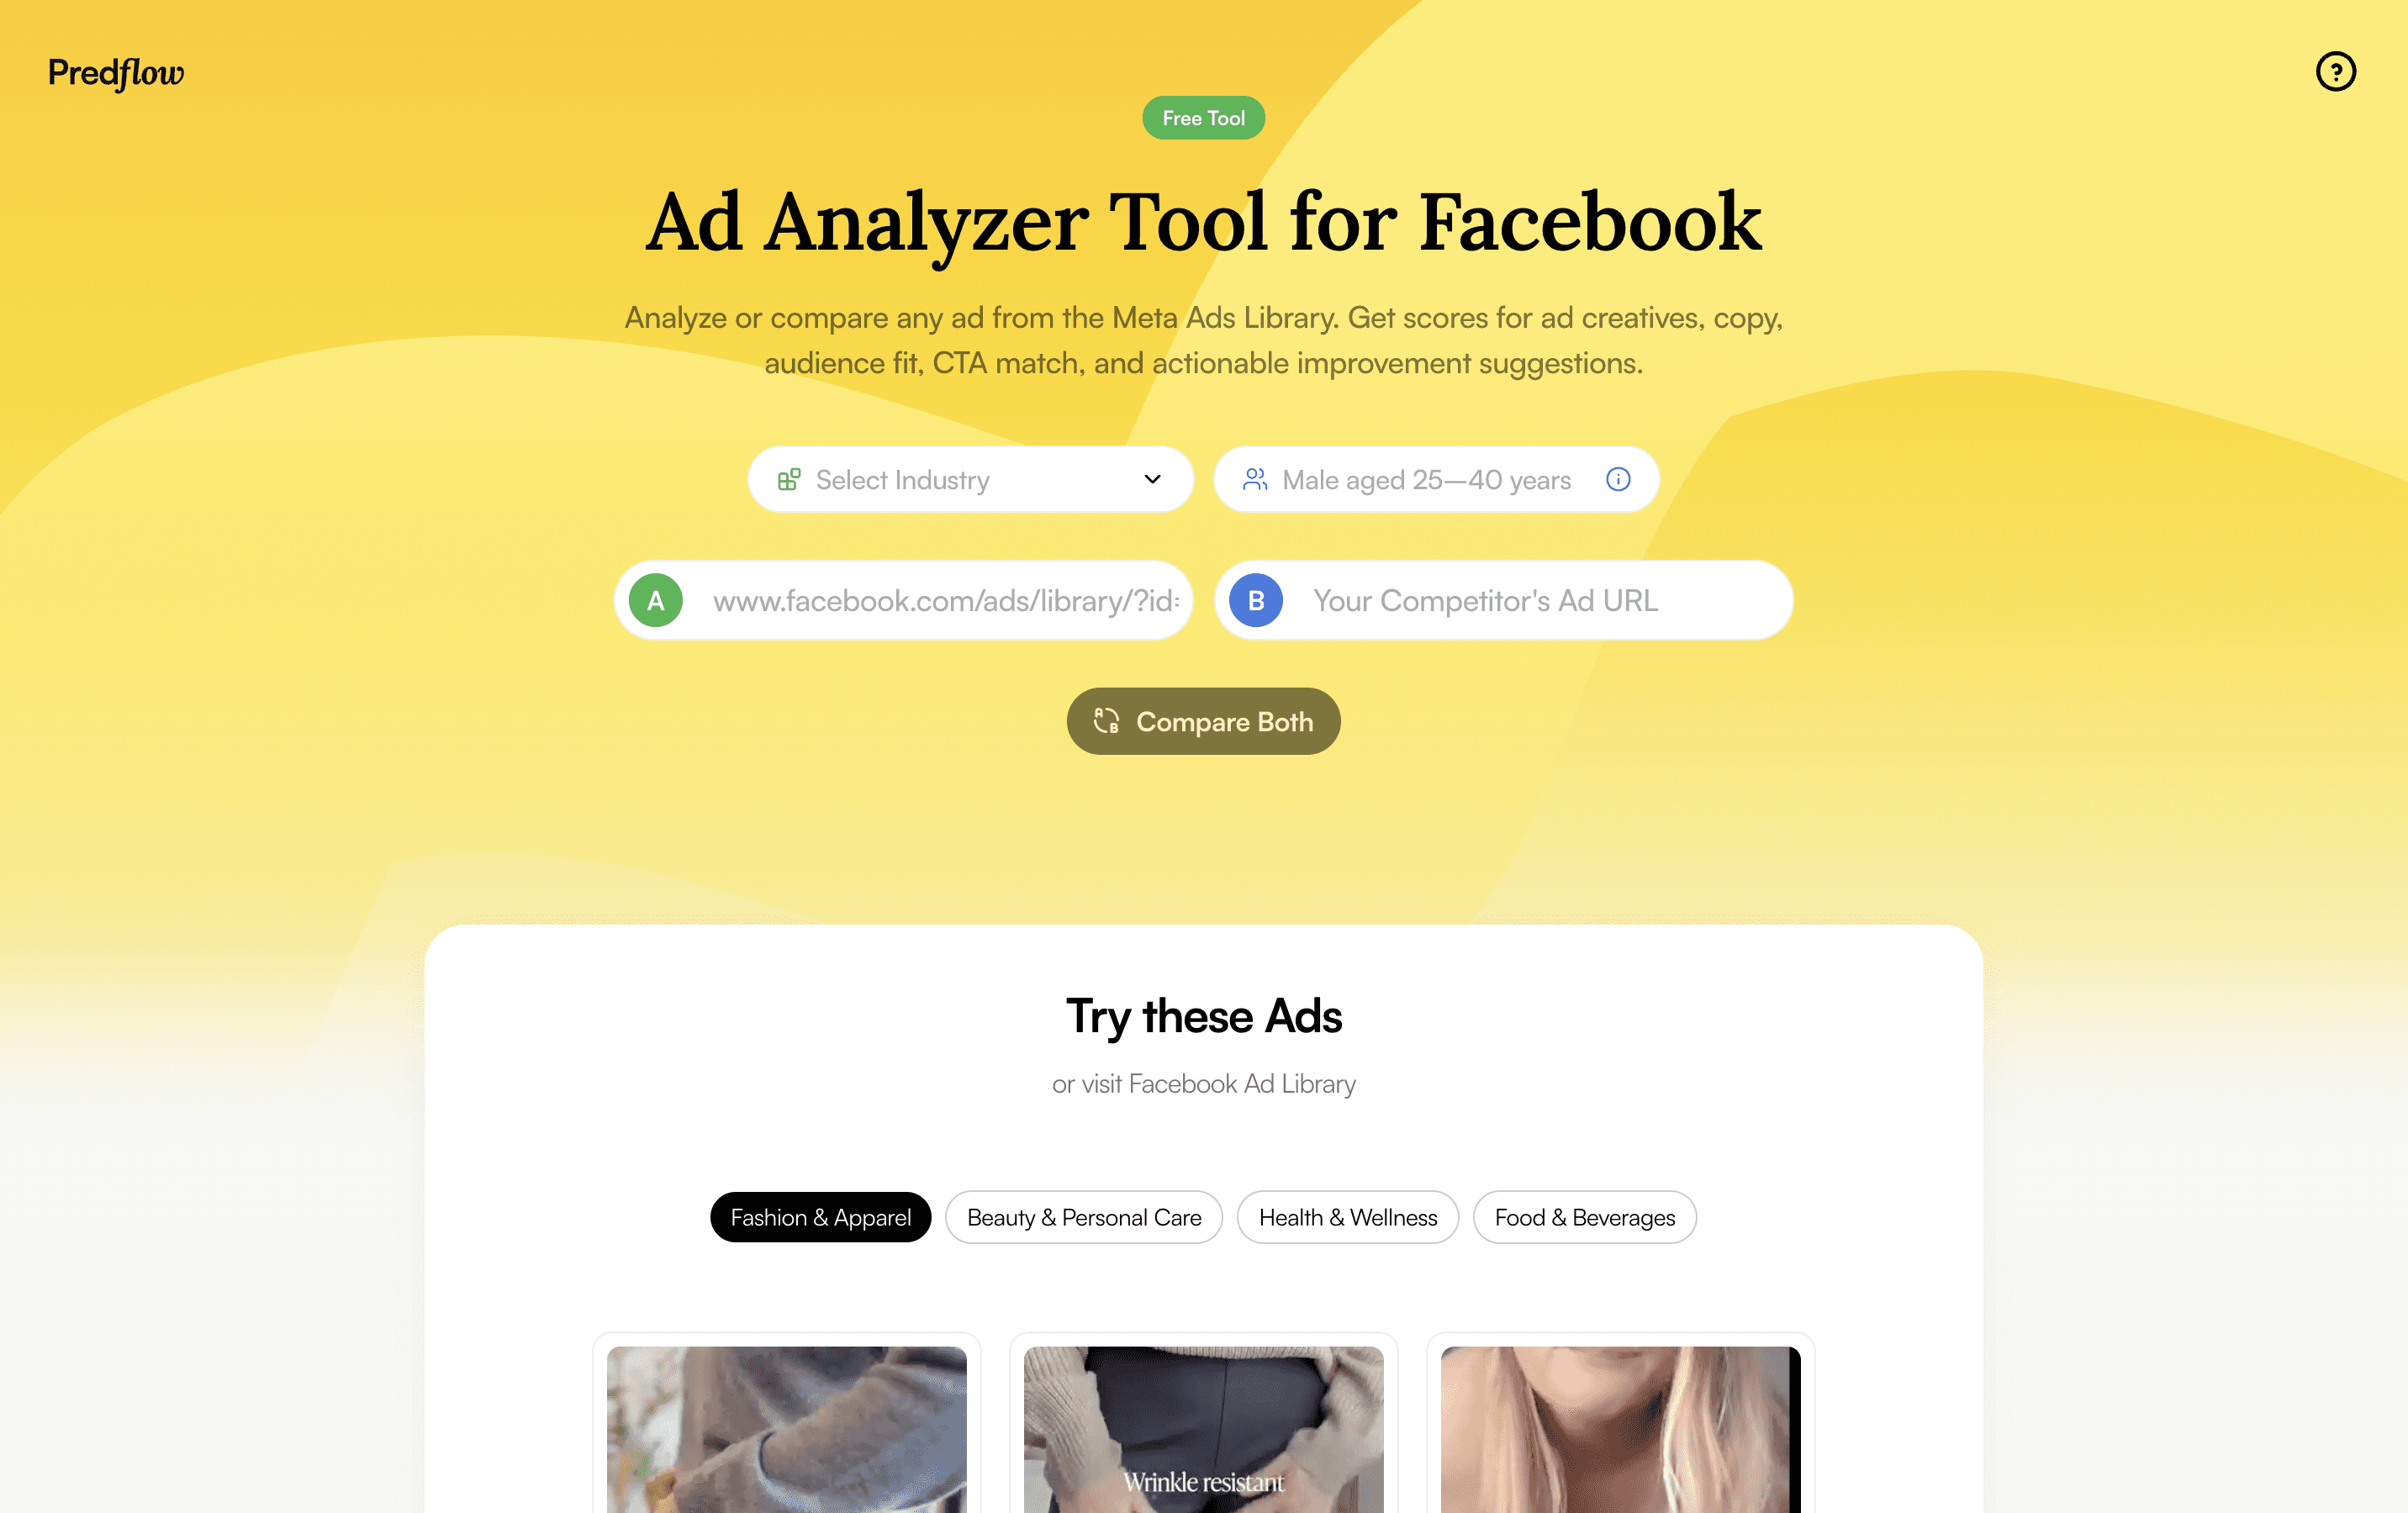
Before changing spend, creative, or targeting, make sure you know what actually changed. If ROAS dropped, diagnose the root cause before reacting. If creatives are underperforming, score them with Predflow’s free ad analysis tool before assuming the audience is the problem.
The brands that grow profitably are not the ones with the nicest dashboards.
They are the ones that understand where reporting falls short and where revenue leaks after the order is placed.
Shopify is not broken.
It is just being asked to do more than it was built for.
Improve Ad performance with Predflow
Diagnose performance drops, creative fatigue, and attribution shifts


