


Ad Tracking for D2C Brands: 7 Strategies That Actually Work in 2026
I've seen this too many times. A brand opens Meta Ads Manager, sees 4.2x ROAS, feels good about the month. Then they open Shopify. Revenue is flat. Google is claiming credit for half the same conversions. Three dashboards, three different stories, and nobody in the room can point to a number they actually trust.
This is not a reporting problem. It is a tracking problem. And for most D2C brands, the tracking setup they have right now is actively misleading them.
Ad tracking for D2C brands has gotten harder over the last three years. iOS privacy changes, third-party cookie deprecation, and platform attribution inflation have all worked against you. But most brands have responded by just... accepting the noise. They look at blended ROAS and call it a day. They make budget calls on incomplete data and wonder why scaling is so unpredictable.
These seven strategies fix that. Not all at once, but in a sequence that builds toward data you can actually make decisions from.
1. Switch to Server-Side Tracking Before Anything Else
Browser-based pixels are unreliable. Ad blockers, iOS restrictions, and cookie consent banners mean your Meta Pixel and Google Tag are missing a meaningful share of your actual conversions. Exactly how many depends on your audience and geography, but the gap is real and it is expensive.
When Meta's algorithm trains on incomplete conversion data, it optimises toward the wrong audiences. You are not just losing visibility. You are actively degrading campaign performance.
The fix is server-side tracking. Instead of a pixel firing inside a visitor's browser, your server communicates conversion data directly to Meta via the Conversions API (CAPI) and to Google via Enhanced Conversions. Both need to be running in parallel with your browser-side tracking, not instead of it. The overlap is intentional. Meta and Google use deduplication logic to avoid double-counting.
If you are on Shopify, this is simpler than it sounds. Read the full ecommerce conversion tracking setup guide for step-by-step instructions on getting CAPI and Enhanced Conversions live without a developer.
2. Standardise Your UTM Naming Convention
This is the strategy most brands skip and then spend months paying for.
UTMs are how your Shopify analytics knows where a session came from. If one campaign uses utm_source=meta and another uses utm_source=facebook, Shopify splits them into two separate traffic sources. Same channel, two rows, half the data in each. You will never be able to see the true contribution of a channel if your UTM naming is inconsistent.
Document a naming convention and enforce it. Every ad, every campaign, every team member. The parameters that matter most are utm_source, utm_medium, and utm_campaign. Keep them lowercase, keep them consistent, keep them meaningful.
A simple rule: if a new media buyer joined tomorrow and had to read your UTM strings to understand what they were looking at, could they? If the answer is no, your naming convention is not working.
3. Reconcile Platform Data Against Actual Shopify Revenue
Most guides stop at setting up pixels and UTMs. This is where the real work starts.
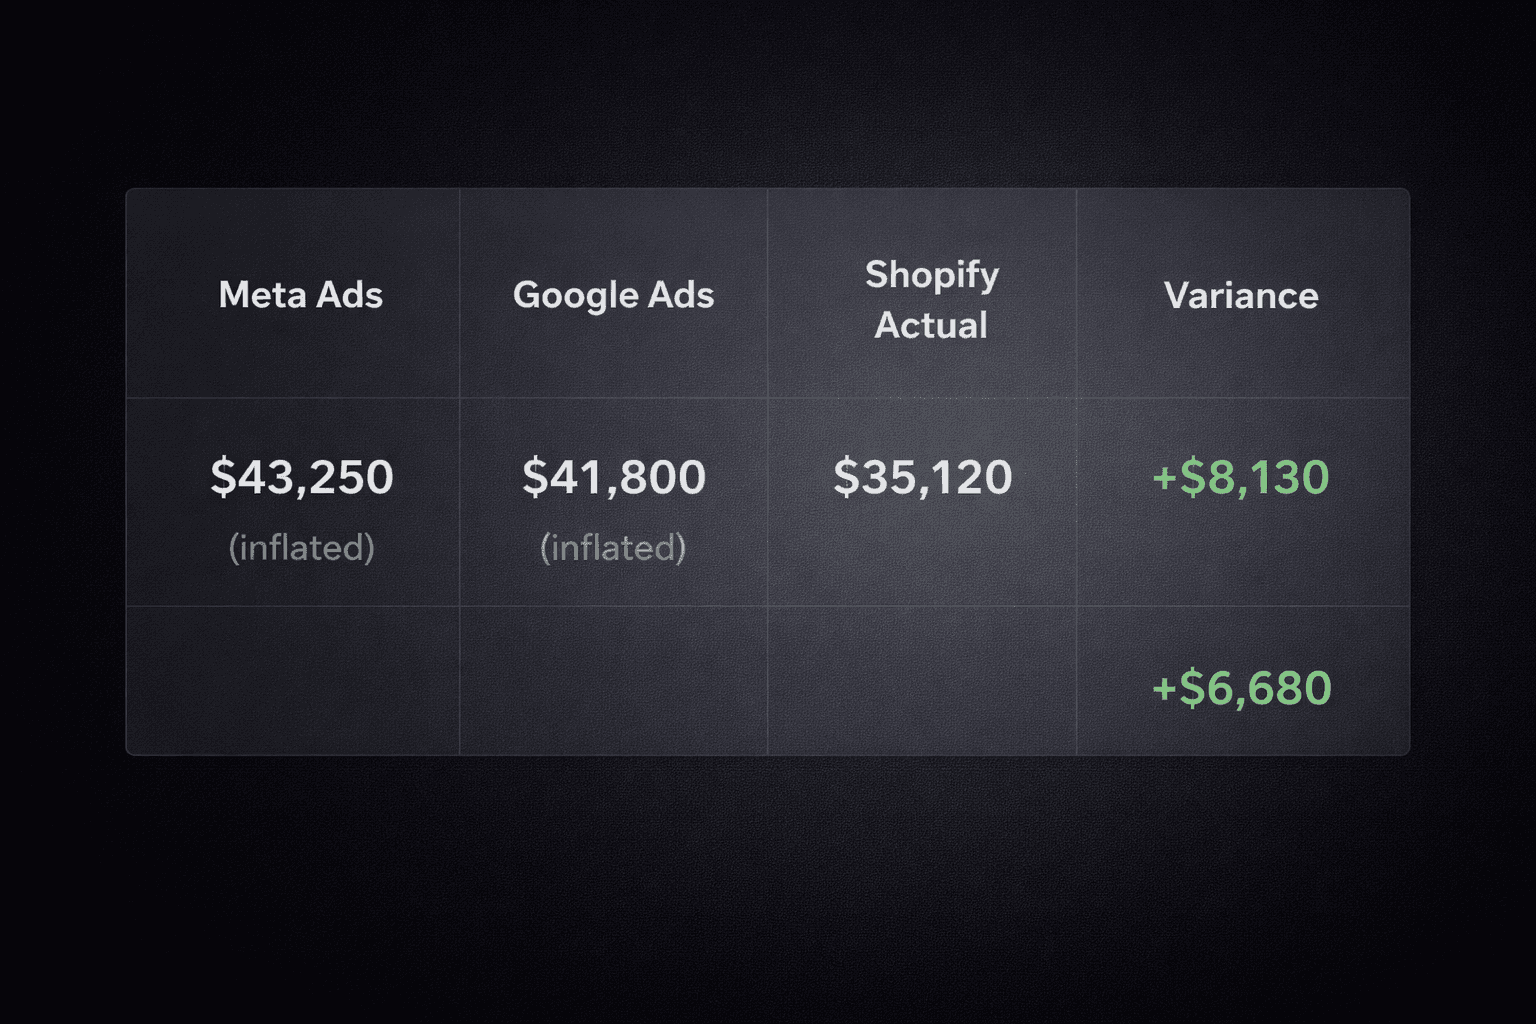
Once your tracking is live and running for at least seven days, pull three numbers side by side: Meta reported purchase revenue, Google Ads reported conversion value, and Shopify actual revenue. Now add the first two together. The total will almost always be higher than Shopify. Sometimes significantly higher.
That gap is attribution inflation. Every platform takes credit for every conversion it touched. A customer who clicked a Meta ad and a Google ad before purchasing gets counted as a full conversion by both platforms. Your combined reported ROAS is a fiction. Your actual ROAS is Shopify revenue divided by total ad spend.
The size of this gap tells you how much you have been over-crediting your channels. I have seen brands where the combined platform ROAS was 5x but the actual blended ROAS was 2.1x. Those are completely different businesses with completely different budget strategies.
Do this reconciliation every week. Not monthly. Weekly, because decisions compound. A week of scaling the wrong channel based on inflated platform data costs real money.
4. Move Away From Last-Click Attribution
Last-click attribution gives 100% of the credit for a conversion to the final touchpoint before purchase. In most D2C setups, that means branded search or direct traffic gets the credit, while the Meta prospecting campaign that actually created the demand gets nothing.
This is why teams kill their best prospecting campaigns. The data says they are not performing. The reality is they are driving demand that branded search then captures. Last-click makes branded search look like a hero and upper-funnel channels look like waste.
Multi-touch attribution distributes credit across every touchpoint in the customer journey. It is not perfect, nothing is, but it is far more honest than last-click. The specific model matters less than the principle: your prospecting campaigns need to get credit for the awareness they create, or you will systematically underfund them.
For D2C brands using Predflow, multi-touch attribution is built into the platform and reconciled against actual Shopify revenue. So the numbers you see reflect reality, not platform optimism.
5. Track Creatives at the Hook and Angle Level, Not Just Ad ID
Most brands track performance at the ad level. Ad 1234 got 2.3x ROAS. Ad 1235 got 1.8x ROAS. This tells you what is winning but not why.
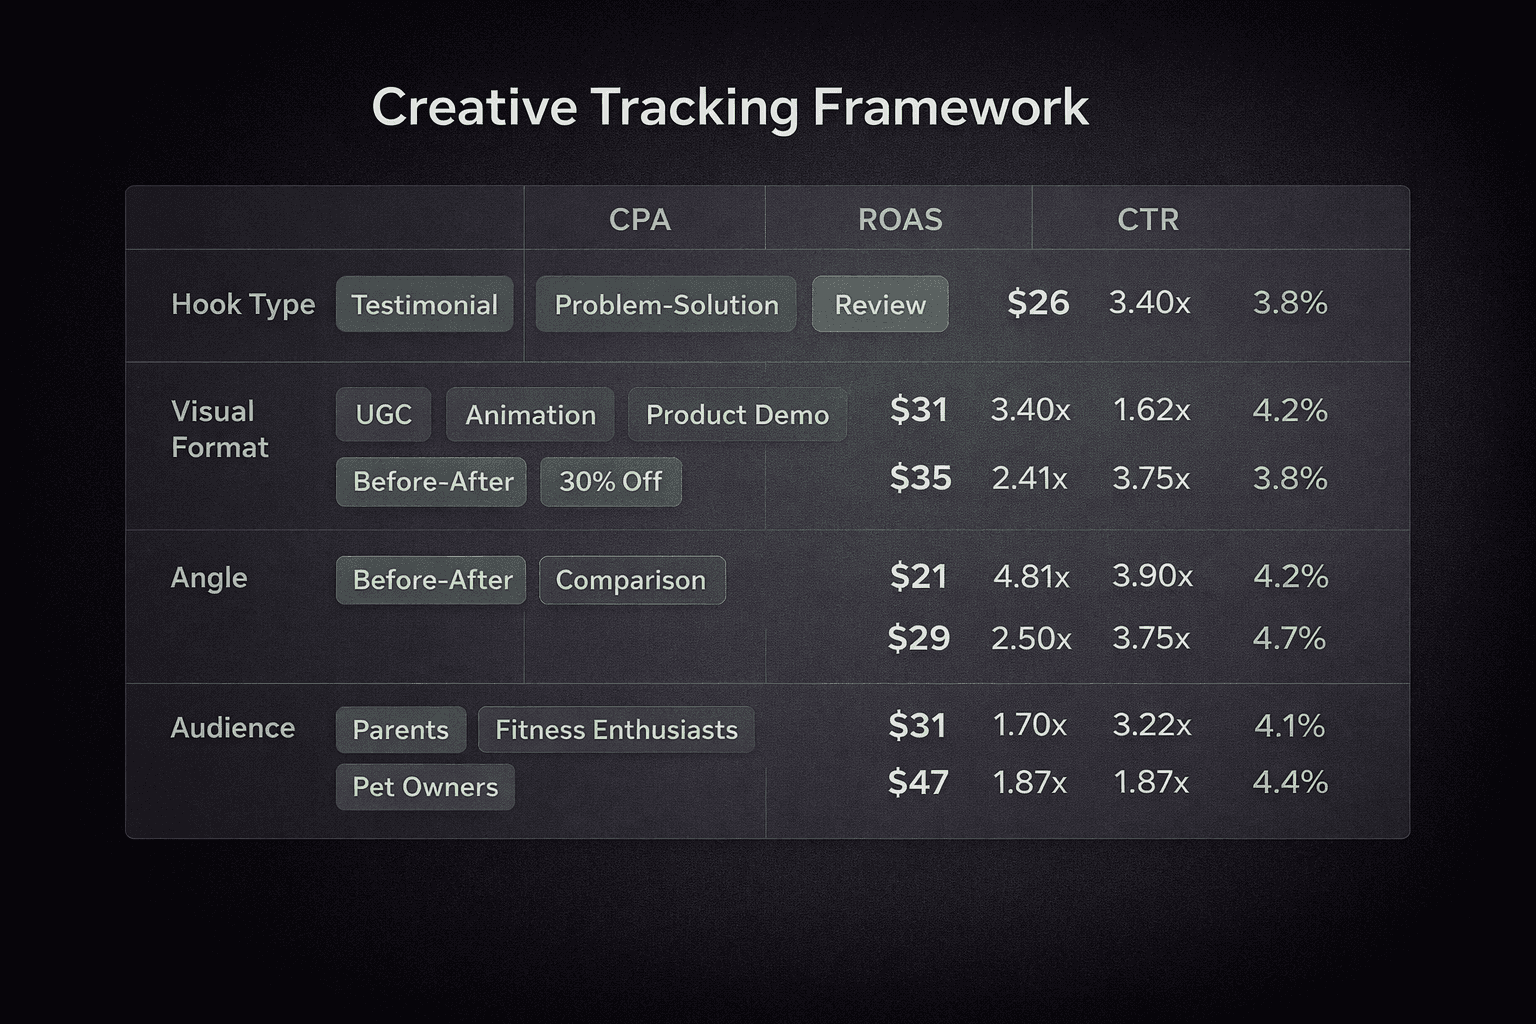
The why lives in the creative elements. Was it the hook? The visual format? The CTA? The angle (social proof vs. product feature vs. problem-solution)? If you cannot answer that question, every new creative brief starts from scratch. You are not learning from your data, you are just running more tests.
Build a tagging system for your creatives. Before you launch any ad, tag it with the hook type, the visual format, the angle, and the audience. When you analyse performance, you analyse by tag, not by ad ID. Over time you build a library of what works for your specific audience. That library is a competitive advantage. It is also what makes briefing your designers specific instead of vague.
This is the difference between saying "make it more engaging" and saying "our problem-solution hooks with static visuals are outperforming UGC format by 40% on cold audiences right now, let us brief three more with that structure."
6. Set Up Anomaly Monitoring So You Do Not Find Out on Mondays
The pattern I see constantly: ROAS drops on a Thursday. Nobody notices until the Monday standup. By then, four days of budget have gone into a broken campaign and the team is scrambling to explain something that already happened.
Anomaly monitoring means setting thresholds on your key metrics, ROAS, CTR, CPC, spend, and getting alerted when they move outside normal ranges. The alert is not the insight. The alert is the trigger to investigate before it becomes expensive.
The investigation matters as much as the alert. A ROAS drop has different causes. Creative fatigue, audience saturation, a competitor entering the auction, a landing page issue, a Shopify checkout problem. If your monitoring just tells you "ROAS dropped" without helping you narrow down the cause, you are still spending an hour in spreadsheets every time something breaks.
Predflow's performance alert system monitors your campaigns continuously and surfaces the likely root cause alongside the alert, so you come to the standup with a diagnosis, not just a chart showing something went wrong.
7. Build One Source of Truth That Connects Ads to Revenue
The endgame of everything above is a single view where your ad spend, your conversions, and your actual revenue all tell the same story. Not three dashboards that contradict each other. One number for ROAS that you can defend in a founder meeting because you know exactly how it was calculated.
This requires three things working together. Clean tracking data coming in through server-side channels. Consistent UTM naming so sources are correctly attributed. And a reconciliation layer that ensures attributed revenue never exceeds actual Shopify revenue.
Most analytics tools handle the first two but skip the third. They pipe your data into a dashboard and call it attribution. The reconciliation step, where platform claims get checked against what actually hit your bank account, is what separates data you trust from data you just present.
If you are on Shopify, you can start building this foundation today by connecting Predflow via the Shopify App Store. It pulls in your actual order data as the baseline and reconciles your ad platform data against it, so the numbers you see reflect what actually happened.
The Real Cost of Bad Tracking
Bad tracking is not a reporting problem. It is a compounding decision problem. Every budget allocation, every creative brief, every channel evaluation is downstream of the data you trust. If that data is inflated, inconsistent, or fragmented, every decision built on it is slightly wrong. And slightly wrong decisions, made every week for twelve months, add up to a lot of wasted spend.
The brands that consistently grow their ad performance are not necessarily the ones with the biggest budgets or the best creatives. They are the ones who know exactly what their data is telling them. That starts with tracking that actually works.
Improve Ad performance with Predflow
Diagnose performance drops, creative fatigue, and attribution shifts


