Supply Chain
5 Procure to Pay Metrics Every Supply Chain Manager Should Track
Track the right procure to pay metrics to fix invoice exceptions, late payments, and match failures before they spiral. Here are the 5 KPIs that actually matter.
Denisha R
Product, Predflow

Your procure to pay dashboard probably looks cleaner than it should. Spend volumes are up, PO counts are healthy, and approval rates look fine. But your AP team is working overtime chasing three-way match failures, suppliers are calling about late payments, and nobody can explain why invoices keep stacking up in exceptions.
The problem is not your team. It is that most P2P dashboards measure activity, not process health. They show you how much work is moving through the system without telling you where it is breaking down or what it is costing you.
Rising cost pressures and the demand for real-time financial visibility are stretching legacy procurement and finance systems past their limits. The organizations that stay ahead are the ones that track the right five metrics, not the most metrics.
These five KPIs expose where your procure to pay process is actually bleeding time and money, not just where it looks clean on a screen.
Why Most P2P Dashboards Track Vanity Metrics Instead of Process Health
The difference between activity metrics and outcome metrics in procure to pay
Activity metrics count what happened. Outcome metrics reveal whether what happened was healthy.
Spend volume, total PO count, and number of invoices processed are activity metrics. They tell you the system is running. They do not tell you whether it is running well. Outcome metrics like exception rate, cycle time, and cost per invoice tell you where the process is breaking and what it will cost if you leave it alone.
The distinction matters because supply chain managers who track only activity metrics optimize for throughput. Managers who track outcome metrics optimize for reliability, which is what actually protects cash flow and supplier relationships.
How legacy P2P systems create measurement blind spots
A consistent pattern in procurement failure is that teams deviate from defined P2P procedures without that deviation showing up in standard reporting. The downstream consequence is conflict with AP teams, especially when suppliers escalate unpaid invoices that procurement assumed were already processed.
This is what measurement blind spots look like in practice. The process appears to be running because POs are being raised and invoices are being logged. But the handoffs between procurement, receiving, and AP are breaking silently, accumulating in exception queues that only become visible when supplier relationships are already strained.
Legacy ERP automation and disconnected workflow tools make this worse. Each system reports its own activity accurately. No system reports what happens in the gaps between them. That is where procure to pay loses money.
Metric 1: Purchase Order Cycle Time — The First Signal of Procure to Pay Friction
How to calculate PO cycle time and set a meaningful baseline
PO cycle time is the number of days between the moment a purchase requisition is submitted and the moment a purchase order is approved and sent to the supplier.
Formula:
PO Cycle Time = Date PO Approved minus Date Purchase Requisition Submitted
A three-day cycle time means your approval workflow is clean and authority levels are clearly defined. A twelve-day cycle time means something is waiting somewhere, and that wait is costing you supplier lead time you cannot get back.
Start by pulling the last 90 days of PO data from your ERP or procurement automation software. Calculate the average and then the 90th percentile. The average hides healthy transactions. The 90th percentile shows you the worst of your process, which is usually where the real problem lives.
What inflated PO cycle time actually signals about approval workflows
A twelve-day cycle time is almost never a people problem. It is a process design problem.
Common causes include approval chains that require sign-offs from people who were never told they were in the chain, requisitions routed to the wrong cost center and silently sitting in the wrong inbox, and manual handoff steps between systems that require someone to copy data from one tool to another before the process can continue.
The three-way match standard, where purchase order, goods receipt, and invoice must align before payment, depends on the PO being accurate when it is first raised. An approval process that takes twelve days almost always produces POs with errors introduced during that delay. Those errors become invoice exceptions three weeks later when AP tries to process payment.
If your PO cycle time is above five days, the root cause is usually a workflow design problem, not an approval authority problem. The fix is automation workflow redesign, not more sign-off training.
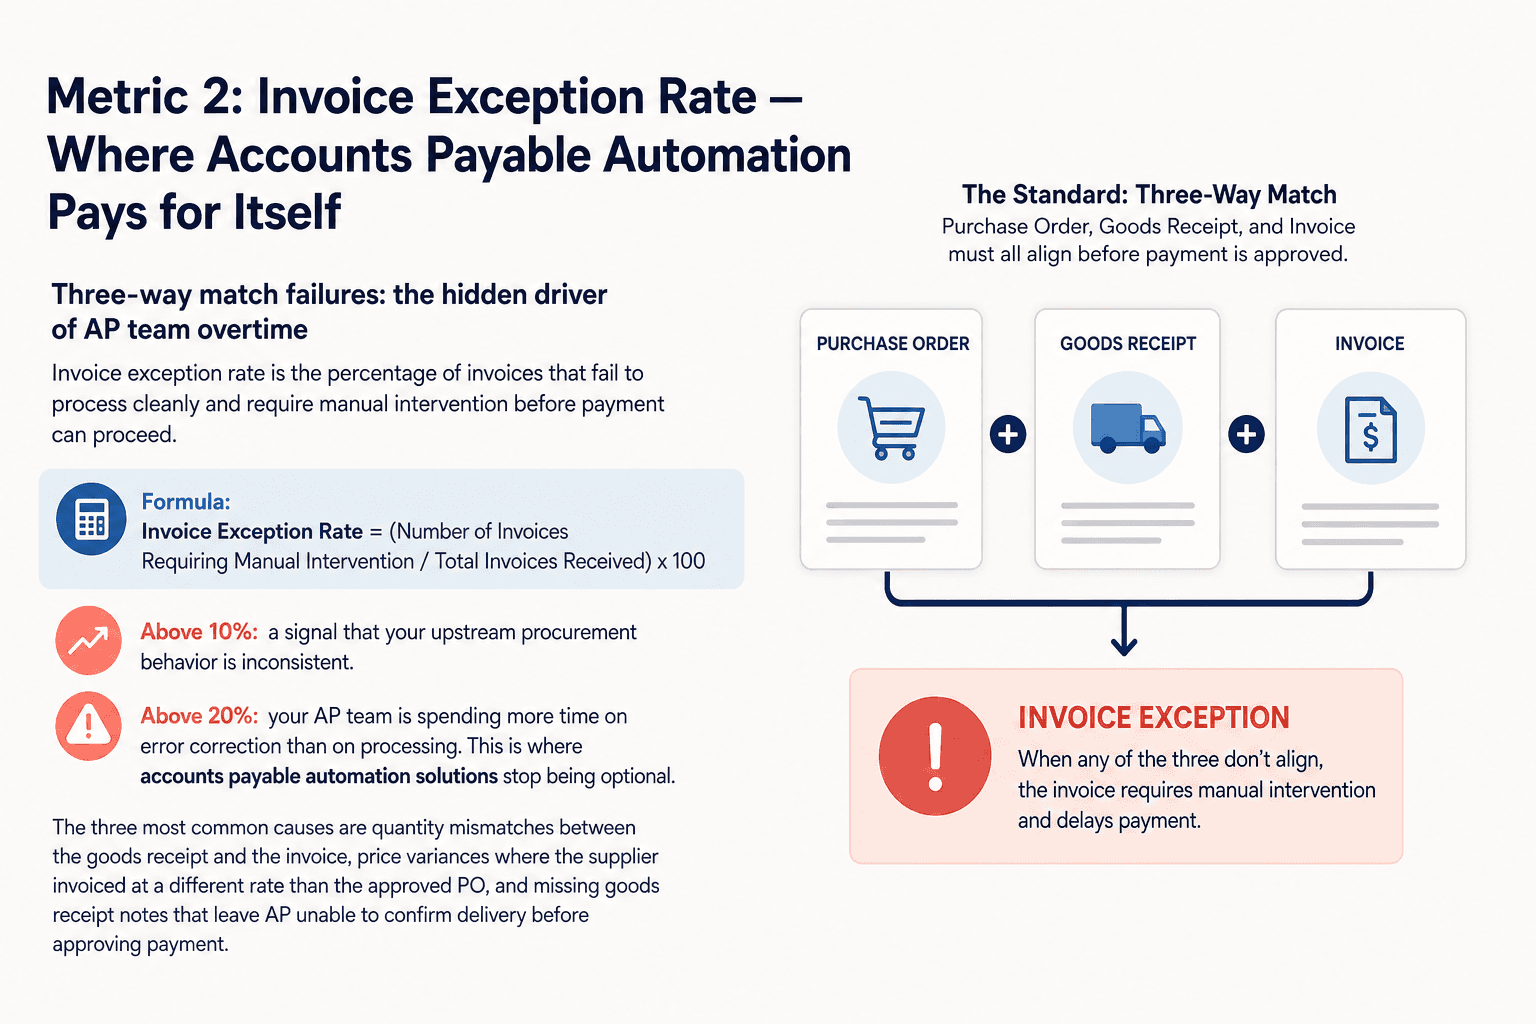
Metric 2: Invoice Exception Rate — Where Accounts Payable Automation Pays for Itself
Three-way match failures: the hidden driver of AP team overtime
Invoice exception rate is the percentage of invoices that fail to process cleanly and require manual intervention before payment can proceed.
Formula:
Invoice Exception Rate = (Number of Invoices Requiring Manual Intervention / Total Invoices Received) x 100
An exception rate above 10 percent is a signal that your upstream procurement behavior is inconsistent. Above 20 percent, your AP team is spending more time on error correction than on processing. This is where accounts payable automation solutions stop being optional.
The three most common causes are quantity mismatches between the goods receipt and the invoice, price variances where the supplier invoiced at a different rate than the approved PO, and missing goods receipt notes that leave AP unable to confirm delivery before approving payment.
What a rising invoice exception rate tells you about upstream procurement behavior
The standard benchmark in AP best practice is a three-way match: the purchase order, goods receipt, and invoice must all align before payment is approved. The exception rate metric tells you in real numbers whether that standard is actually being met in your operation.
A rising exception rate is rarely an AP problem. It is a procurement problem that AP absorbs. When procurement raises POs with incorrect quantities, or when suppliers are not informed of the correct pricing at order time, AP inherits the correction work. That work is invisible in most dashboards because it shows up as "invoice processing time" rather than "error correction time."
Tracking exception rate separately makes the upstream cause visible. If your exception rate climbs when a specific category of spend increases, or when a specific supplier's volume grows, you know exactly where to intervene before the next payment run.
Metric 3: Supplier On-Time Delivery Rate — The Upstream Variable That Breaks Downstream Payments
Linking supplier performance data to payment terms in your P2P process
Supplier on-time delivery rate measures the percentage of purchase orders fulfilled by the supplier within the agreed delivery window. Most supply chain managers track this in a logistics dashboard. Almost none of them connect it to their P2P financial workflow.
That disconnect is where cash flow surprises come from.
When a supplier delivers late, the goods receipt note is delayed. A delayed GRN blocks the three-way match. A blocked three-way match prevents invoice approval. A held invoice triggers a payment delay. That payment delay can breach supplier payment terms, trigger penalty clauses, or damage a supplier relationship that took years to build.
How to use on-time delivery rate as an early warning for cash flow disruptions
The demand for real-time financial visibility has made supplier delivery tracking a finance-level concern, not just an operations metric. A finance team managing payment terms and working capital cannot do so accurately if delivery timing is opaque.
Set a threshold at 90 percent on-time delivery per supplier. Any supplier dropping below that threshold for two consecutive months should trigger a payment terms review and a procurement conversation before the next order cycle, not after an invoice dispute.
This metric belongs in your P2P review alongside invoice exception rate. A supplier with a rising exception rate and a falling on-time delivery rate is a combination that will cost you in rework, late payments, and relationship repair. Catching it early through procure to pay automation dashboards is far cheaper than responding after the damage is done.
Metric 4: Cost Per Invoice Processed — The Metric That Makes the Case for Procure to Pay Automation
How to calculate your true cost per invoice including hidden rework costs
Most AP teams dramatically underestimate their cost per invoice because they count only direct labor. The true cost includes the time spent on exception handling, the cost of systems that touch each invoice, and the rework time for invoices that fail matching and require manual correction.
Formula:
Cost Component | Monthly Total |
|---|---|
AP Team Labor Cost (total AP hours x hourly rate) | $X |
Exception Handling Time Cost | $X |
System License Costs (ERP, AP tools) | $X |
Total Monthly AP Cost | $X |
Cost Per Invoice = Total Monthly AP Cost / Total Invoices Processed
As an example: if your AP team costs $15,000 per month in labor, exception handling adds $4,000 in rework time, and system costs are $2,000, your total is $21,000. If you process 1,400 invoices that month, your cost per invoice is $15.
That is not unusual for a manual or partially automated operation.
Industry benchmarks: manual processing vs. automated invoice processing cost
Fully manual invoice processing typically costs between $12 and $30 per invoice when exception handling and rework are included. Organizations with mature accounts payable automation systems process invoices for $3 to $8 per invoice.
The gap is real and it compounds. At 1,400 invoices per month and a $10 cost difference, that is $168,000 per year in recoverable cost. The calculation does not require optimistic assumptions. It requires honest cost tracking.
If your cost-per-invoice calculation reveals a significant gap, the question becomes how to close it without a multi-year ERP replacement project. Predflow's AI agent platform starts with process mapping, identifying exactly where your P2P workflow loses time and money, before automating the specific handoffs that drive your costs up. Unlike tools-first approaches that automate broken processes faster, Predflow builds agents that understand the context of each invoice exception and handle edge cases that rule-based RPA cannot.
Metric 5: Days Payable Outstanding — How Your Procure to Pay Efficiency Shows Up on the Balance Sheet
DPO formula and what an unhealthy range looks like for your industry
Days Payable Outstanding measures how long your organization takes to pay its suppliers after receiving an invoice. It is the financial output metric that connects all four previous metrics to the CFO's working capital priorities.
Formula:
DPO = Accounts Payable / (Cost of Goods Sold / Number of Days)
A DPO that is too low means you are paying suppliers faster than your payment terms require. You are giving up cash flow you are entitled to hold. A DPO that is too high means you are stretching suppliers beyond their terms, which damages relationships and often results in suppliers building risk premiums into future pricing.
Healthy DPO ranges vary by industry. Manufacturing and retail typically target 30 to 45 days. Service businesses often run 20 to 35 days. What matters more than the industry average is the trend in your own DPO and whether it is moving for the right reasons.
Why optimizing DPO requires fixing process metrics 1 through 4 first
DPO is the summary metric. It is what leadership sees. But it is driven entirely by the four metrics above it.
A long PO cycle time (Metric 1) means invoices arrive before goods do, or goods arrive before a valid PO exists. Either way, the three-way match fails and payment stalls. A high exception rate (Metric 2) holds invoices in manual queues. Unreliable supplier delivery (Metric 3) delays GRNs. High cost per invoice (Metric 4) signals a process too slow and expensive to run at scale.
If your DPO is outside your target range and you cannot explain why, the answer is almost always in Metrics 1 through 4. Fix the process visibility problem there, and DPO moves to where you want it. Accounting automation and ERP automation tools can support this, but they cannot substitute for understanding your process data first.
How to Start Tracking These Metrics Without Overhauling Your Entire P2P Stack
To measure procure to pay process performance, track five core metrics: PO cycle time, invoice exception rate, supplier on-time delivery rate, cost per invoice processed, and Days Payable Outstanding. These five together give you visibility into where your process loses time, money, and supplier trust at every stage of the cycle.
Which metric to baseline first if you are starting from scratch
Start with invoice exception rate. It requires the least infrastructure to calculate, it is visible in any AP system, and it immediately tells you whether your procurement and AP teams are aligned on process standards.
Pull 90 days of invoice data. Flag every invoice that required manual intervention. Divide by total invoices processed. That number, whatever it is, is your baseline. You now have the starting point for every process improvement conversation that follows.
PO cycle time is the second metric to baseline. It requires your procurement system data and typically a simple query or export. Together, exception rate and PO cycle time give you the upstream and downstream view of your P2P process health within two weeks, without buying new tools.
When manual tracking is sufficient and when you need automation workflow support
Manual tracking in a spreadsheet is sufficient when your invoice volume is below 300 per month and your exception rate is under 10 percent. It gives you the baseline data you need to make informed decisions about tooling.
When volume exceeds 500 invoices per month, when exceptions consistently run above 15 percent, or when your team is spending more than 20 percent of their time on manual reconciliation, spreadsheet tracking creates its own overhead. That is the point where a business automation platform or workflow automation tools stop being a cost and start being a cost reduction. The mistake many teams make is investing in automation before they have a baseline. Measure first, automate second. The teams that do it in that order close the gaps that matter. The teams that automate first speed up a process that was already broken.
FAQ
What is the procure to pay process and why does it matter for supply chain management?
The procure to pay process covers every step from raising a purchase requisition to making final payment to a supplier. It matters for supply chain management because it directly connects operational purchasing decisions to cash flow, supplier relationships, and financial reporting accuracy. Inefficiencies in P2P create downstream problems across AP, finance, and vendor management simultaneously.
What is a good benchmark for invoice exception rate in a P2P process?
An invoice exception rate below 5 percent indicates a well-controlled three-way match process. Rates between 5 and 15 percent signal process inconsistency worth investigating. Rates above 15 percent indicate systemic problems in either procurement behavior, supplier data quality, or both, and typically justify a review of accounts payable automation solutions.
How does accounts payable automation reduce cost per invoice processed?
AP automation reduces cost per invoice by eliminating manual data entry, accelerating three-way match validation, and routing exceptions automatically rather than through manual review queues. The largest cost reductions come from reducing exception handling time and removing the human touchpoints that introduce delays and errors in high-volume invoice environments.
What is the difference between procure to pay and source to pay?
Procure to pay starts at the point of purchase requisition and ends at supplier payment. Source to pay starts earlier, at the supplier selection and contracting stage, and runs through payment. Source to pay includes strategic sourcing, vendor qualification, and contract management. Procure to pay focuses on the transactional execution of purchasing within already-approved supplier relationships.
How does Days Payable Outstanding connect to working capital management?
DPO measures how long a business holds cash before paying suppliers. A higher DPO means the business retains cash longer, which improves short-term liquidity. But DPO that exceeds agreed payment terms damages supplier relationships and working capital strategy. Finance teams use DPO alongside accounts receivable automation metrics to manage the gap between cash coming in and cash going out.
Conclusion
If three or more of these five metrics are currently unmeasured in your operation, the issue is almost never a people problem. It is a process visibility problem. Your team cannot fix what they cannot see, and they cannot justify automation investment without a baseline that shows where the cost is actually sitting.
The most effective next step is not a platform review or an RFP. Pick the single metric your team has the least visibility into right now, and build a two-week baseline before considering any tooling change. The teams that grow their P2P capacity without proportionally growing headcount are the ones that measure before they automate.
If your P2P metrics reveal gaps you want to close without a full platform replacement, see how Predflow maps your existing process before automating it. Book a process mapping call.
FAQ
Frequently asked questions
What exactly is an AI agent
An AI agent is an autonomous system designed to handle specific business tasks end-to-end. Unlike simple chatbots, AI agents can reason, take actions, integrate with tools, and follow defined workflows.